
Interactive data storytelling
Some of the best explainers on the internet are built from data you can poke at. These sites turn big datasets into scrollable, interactive stories with charts that respond as you read. The Pudding runs visual essays on culture, Our World in Data covers global trends with sourced charts, and OEC maps how countries trade.

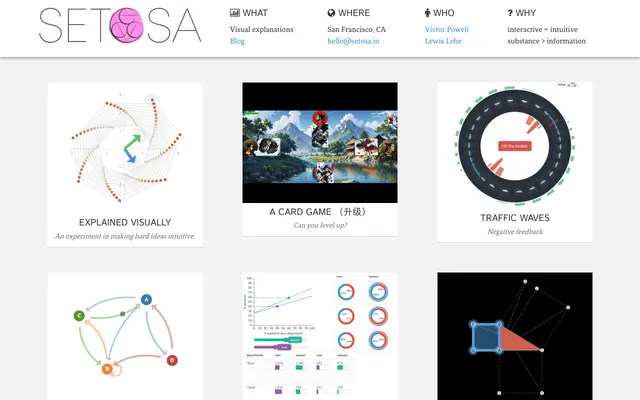
setosa.io
Setosa is a small collection of interactive visual explanations for concepts that are hard to picture, from eigenvectors to Markov chains to Bayes' theorem. You drag and tweak the visuals to build intuition instead of reading equations. It is free to explore.

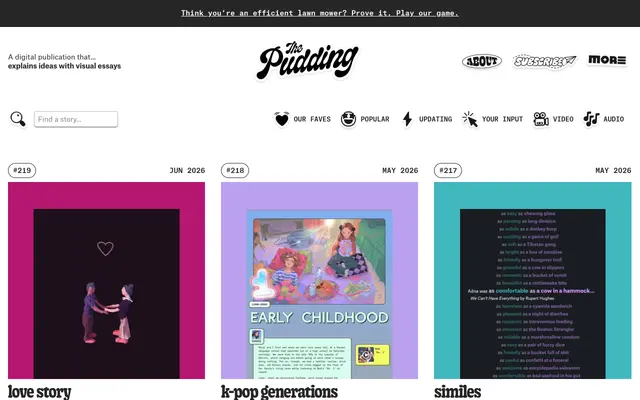
pudding.cool
The Pudding is a digital publication that explains ideas debated in culture through visual, interactive essays. Each piece combines original data, charts, and playful scrollytelling. Topics range from hip-hop lyrics to gender bias to film dialogue.
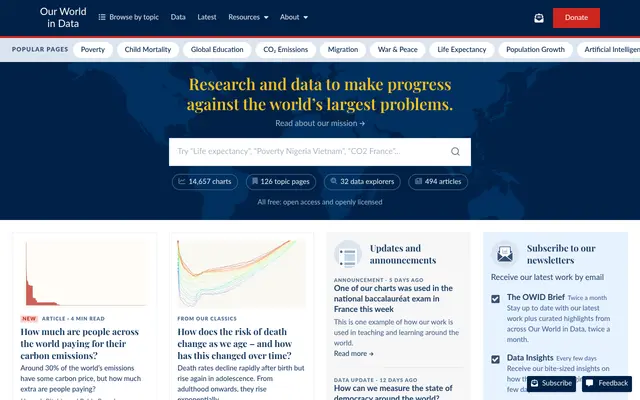
ourworldindata.org
Our World in Data is a nonprofit publication presenting research and data on global living conditions. It covers health, poverty, climate, energy, and more with clear, downloadable interactive charts. All content and data are free and open.
Launch your
powerful website
Reach thousands of users across YouTube, Instagram and our newsletter.
- Live within 24 hours
- Custom launch video

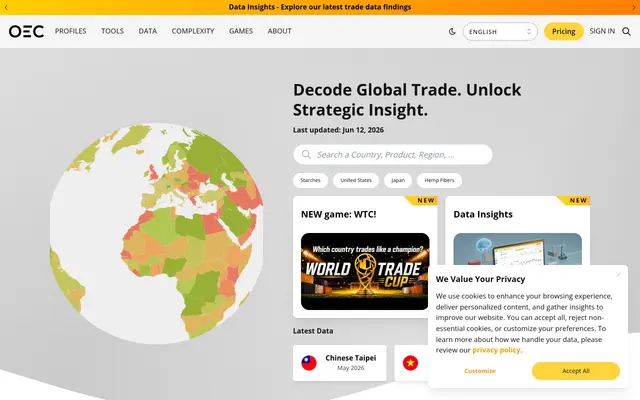
oec.world
The Observatory of Economic Complexity visualizes international trade data for countries and products. Interactive treemaps, flows, and rankings reveal what nations trade and how their economies are structured. It turns dense trade statistics into explorable maps.
Frequently asked questions
Are these free?
Yes, all three are free to read, and Our World in Data and OEC let you download the underlying data and charts.
Do I need special software?
No — everything runs in the browser. Just scroll and interact with the charts.
Can I reuse their charts or data?
Often yes. Our World in Data is openly licensed for reuse with attribution; check each site's terms before republishing.